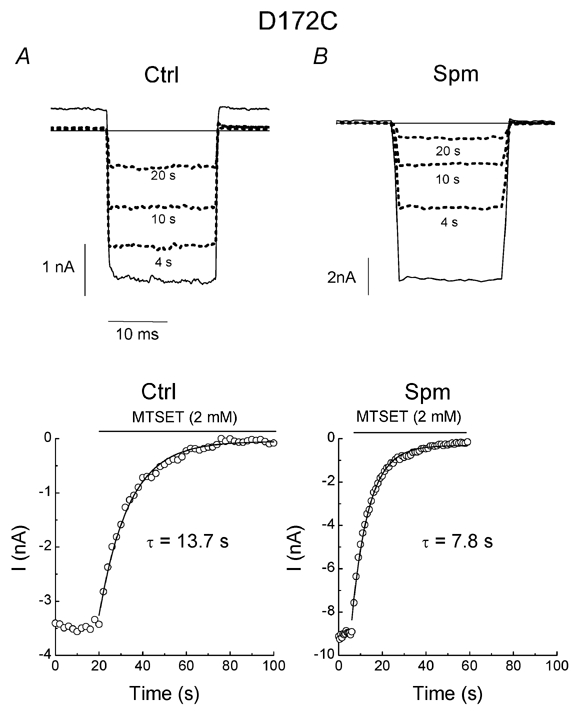
Figure 2. Effects of spermine on MTSET modification in the D172C mutant.

A and B, current traces in the absence and (solid lines) and presence (dotted lines) of MTSET (2 mm) mutant in the control (Ctrl) and 1 µm spermine (Spm), respectively. The number of seconds below each dotted line indicates the time after MTSET treatment. The time courses of MTSET modification in the control and spermine are shown in the lower panels. The horizontal lines indicate the zero current levels.
