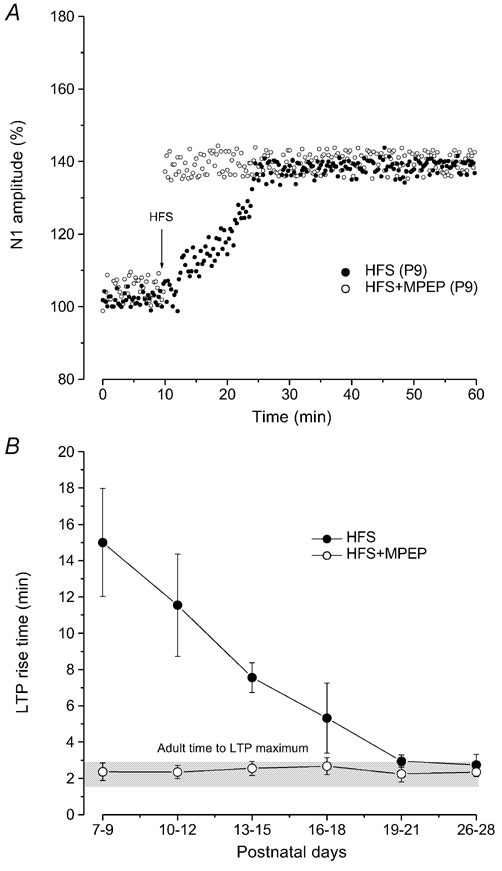
Figure 5. Effect of mGluR5 block (MPEP) on the rise time of LTP induced by HFS during postnatal development.

A, time courses of LTP induced by HFS at P9 in untreated slices (•) and under MPEP (^). The arrow indicates the time of delivering HFS. Note the consistent reduction of rise time when LTP is induced in the presence of MPEP. B, plot showing the rise time of LTP induced by HFS at different ages in untreated slices (•) and in the presence of MPEP (^). Each point represents the mean ± s.d. of LTP rise time (min) evaluated by pooling all the values obtained from three consecutive age groups. Note that following application of MPEP the LTP rise time is similar to that observed in the adult (grey bar) at all the examined ages.
