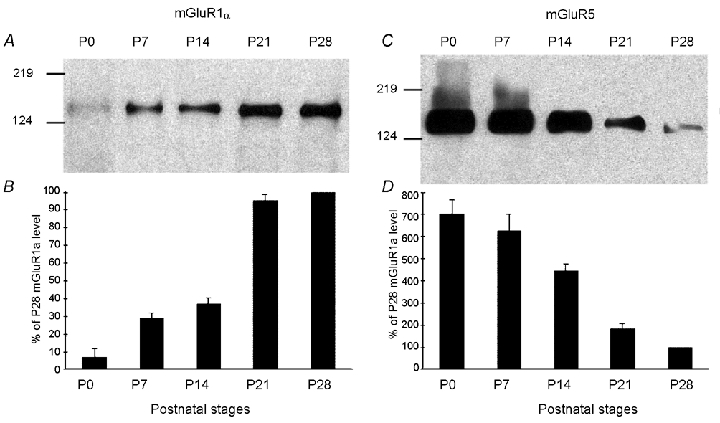
Figure 7. Western blot analysis of mGluR1α and mGluR5 expression in the VN during postnatal development (P0 to P28).

Protein extracts from rat microdissected VN at different postnatal (P) days were collected and analysed for mGluR1α (A) and mGluR5 (C) expression by Western blot. Note the opposite trend of the changes for mGluR1α and mGluR5 during VN development (B and D). Data are expressed according to developmental stage (P). The optical density of mGluR subunits for each stage is normalized as a percentage versus the P28 value of mGluR expression (100 %). Each data point represents the average value from five experiments. Molecular weight markers are shown on the left.
