
Figure 3. Concentrations of glucose at abluminal surfaces of villus capillaries (Cb): effects of blood flow.
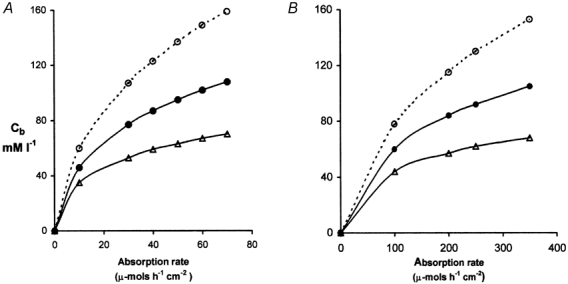
A, data from rat showing the relation between Cb and the intestinal absorption rate of glucose (JS) under three conditions where the increase in villus blood flow (and hence PS) with JS is either ‘normal’ (i.e. Qb = 0.11 + 0.018JS as in Table 2) shown by • in the middle curve, twice ‘normal’ (▵) or half ‘normal’ (^). B, similar data from human subjects where the ‘normal’ response is given by Qb = 0.9 + 0.02JS and the same symbols as in A show half ‘normal’ and twice ‘normal’ responses.