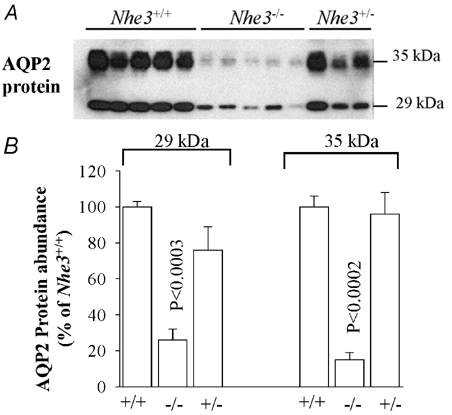
Figure 2. AQP2 protein abundance in the kidney cortex of Nhe3+/+, Nhe3+/- and Nhe3−/− mice.

A, immunoblot of AQP2 protein level in the cortex. Both 29 and 35 kDa bands are detected by the anti-AQP2 antibody in the kidney cortex. B, densitometry of AQP2 protein (29 and 35 kDa) expression in the cortex showing a decrease in the abundance of both 29 kDa (n = 5) and 35 kDa (n = 5) bands in Nhe3−/− as compared to Nhe3+/+ mice. These two bands were not significantly altered in Nhe3+/-(n = 3) as compared to Nhe3+/+ (n = 5); 16 µg of total protein from the cortex was loaded per lane.
