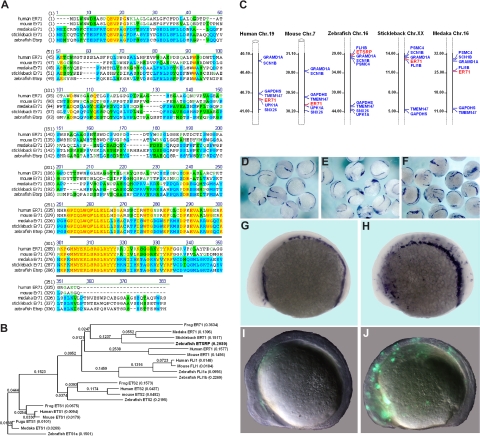
Figure 1.
Etsrp is a functional ortholog of the mammalian ER71 subfamily. (A) Alignment of zebrafish Etsrp, medaka, stickleback, mouse, and human ER71 amino acid sequences. Identical and similar amino acids are labeled in red and blue, respectively. Etsrp and hER71 share 71% homology within the ETS DNA-binding domain (underlined in gray). GenBank accession numbers used for the analysis are as follows: human ER71 (O00321), mouse ER71 (NP_031985), and zebrafish ETSRP (AAY89037). Medaka ER71 (ENSORLP00000019929) and stickleback ER71 (ENSGACP00000016315) are Ensembl predictions. (B) Phylogenetic analysis of zebrafish Etsrp and its closest human, mouse, frog, and fish homologs. The phylogenetic tree is built using the Neighbor Joining method. Length of horizontal branches is proportional to the evolutionary distance between the protein molecules. GenBank accession numbers used for the analysis are as follows: human ER71 (O00321), mouse ER71 (NP_031985), zebrafish ETSRP (AAY89037), human ETS1 (NP_005229), mouse ETS1 (NP_035938), frog ETS1 (NP_001081621), zebrafish ETS1a (NP_001017558), human ETS2 (NP_005230), mouse ETS2 (NP_035939), frog ETS2 (NP_001081007), zebrafish ETS2 (NP_001018874), human FLI1 (NP_002008), mouse FLI1 (NP_032052), zebrafish FLI1a (NP_571423), and zebrafish FLI1b (NP_001008780). Medaka ER71 (ENSORLP00000019929), stickleback ER71 (ENSGACP00000016315), fugu ETS1 (SINFRUP00000163510), and medaka ETS1 (ENSORLP00000016939) are Ensembl predictions. NTI Vector (Invitrogen) has been used to build the alignment and the phylogenetic tree. (C) Chromosomal location of the zebrafish etsrp, medaka, stickleback, mouse, and human ER71 genes. Numbers alongside the chromosomal regions of interest correspond to the actual physical distances (Mb). Etsrp/ER71 genes are highlighted in red. (D-J) Mouse ER71 and zebrafish Etsrp overexpression causes ectopic expression of hemangioblast marker scl and vascular endothelial marker flk1. flk1-GFP transgenic embryos were injected with 75 pg of either Etsrp or mER71 DNA at the 1-cell stage and analyzed at 8- to 10-somite stages. Relative to uninjected embryos (D,G), both Etsrp (E) and mER71 (F,H) result in the ectopic induction of scl when examined by in situ hybridization. Flk1 expression was also induced by ER71 injections as revealed by ectopic GFP expression (J) relative to uninjected controls (I). Panels G to J are lateral views with anterior to the left. Images were taken using Zeiss CV11 stereomicroscope, Axiocam color camera (Zeiss, model 412-312) and Openlab 4.0 software (Improvision, Waltham, MA). Magnification: 12× (D-F); 60× (G-J).

