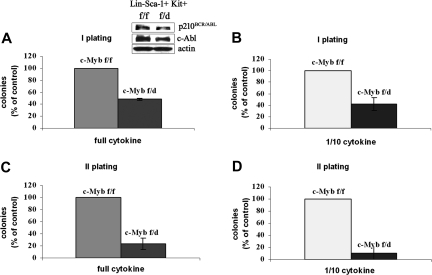
Figure 5.
Colony formation of p210BCR/ABL-transduced c-Mybf/d HSCs. Lin−Sca-1+Kit+ cells from c-Mybf/f or c-Mybf/d mice were transduced with the MigRI-p210BCR/ABL retrovirus, GFP sorted, assessed for p210BCR/ABL levels, and plated in methylcellulose (2.5 × 10³ cells/plate) in the presence of an optimal cytokine concentration (A) or 1/10th of the full cytokine doses (B). In panel A, inset shows p210BCR/ABL levels detected by anti–c-Abl Western blotting. Colonies were scored after 7 days. Values (P ≤ .001) are expressed as the percentage of the number of colonies derived from c-Mybf/f HSCs. Secondary colony formation assays were performed using cells isolated from methylcellulose. Cells were replated onto new plates in the presence of an optimal cytokine concentration (C) or 1/10th of the cytokines (D) and scored again after 7 days. Values (P ≤ .001) are expressed as the percentage of the number of colonies derived from c-Mybf/f HSCs. Representative of 3 different experiments.

