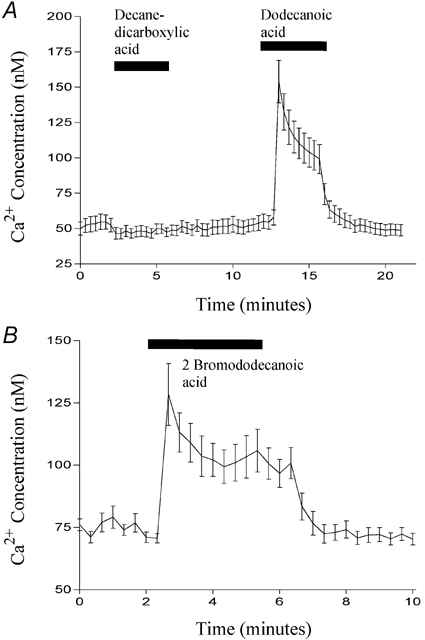
Figure 8. The effect of various chemical modifications on fatty acid-induced Ca2+ mobilisation.

The effect of 500 μm decanedicarboxylic acid (first bar; A), dodecanoic acid (second bar; A) or 2-bromododecanoic acid (bar; B) on [Ca2+]i (nm) in STC-1 cells. Cells were exposed to each fatty acid for 3 min. Fluorescent images were acquired every 20 s and cells were identified using global thresholding to create a binary image which was applied to the ratio images to identify the regions of interest. The ratio for each region was calculated and all the regions were then averaged to give a mean ±s.e.m. fluorescence ratio for all cells present in the field. This was then converted to a Ca2+ concentration (nm) using standard calibration techniques (see Methods) and plotted on the ordinate. The number of cells which make up each mean is 14 (A) and 15 (B) and these figures are representative of at least four other experiments.
