
Figure 1. Time course of changes in cortical blood flow during hypoxia.
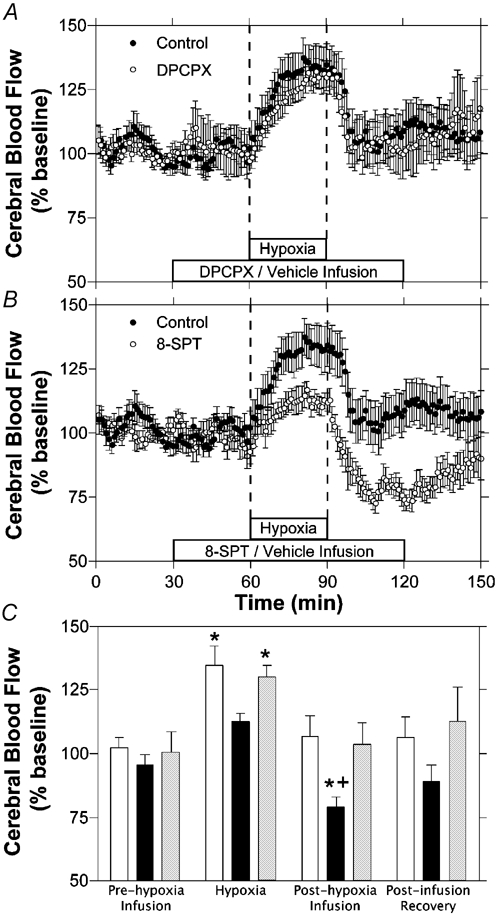
Results are shown for hypoxia with intravenous infusion of vehicle (A and B, n = 7), DPCPX (A, n = 7) or 8-SPT (B, n = 7). C, comparison of cortical blood flow changes from baseline measurements for control (open bars), 8-SPT (black bars) and DPCPX (grey bars) experiments. Bars represent mean values for each of the three experimental groups during the last 10 min of each of the four experimental periods labelled. Error bars indicate s.e.m.* Significant change from baseline period. + Significantly different from control experiments at that time period.