
Figure 3. Comparison of the amplitudes and intervals between phasic contractions in +/+ and W/Wv mice.
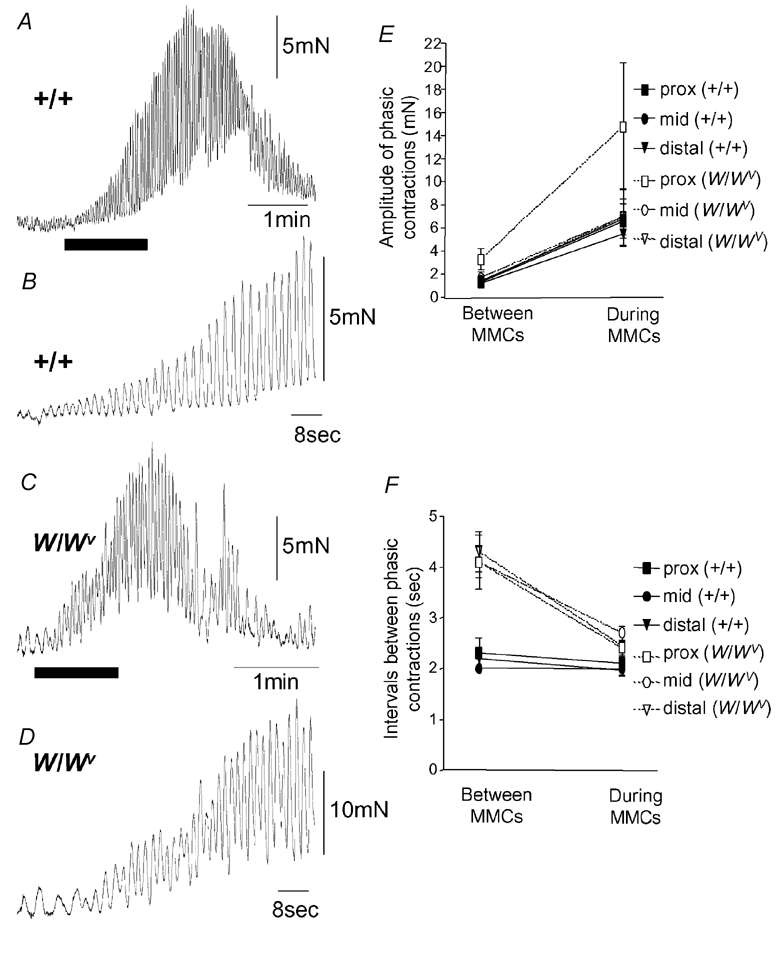
A, a single MMC contraction recorded from a +/+ mouse ileum. The recording represented by the black bar is shown on expanded time scale in B. B, the increase in amplitude of phasic contractions during the onset of the MMC. Note, the interval between phasic contractions does not change. C, a single MMC contraction recorded from a W/Wv mouse. The black bar is shown on an expanded time scale in D. D, the increase in amplitude and decrease in interval between phasic contractions during the onset of the MMC. E, a graphical representation of the changes in phasic contraction amplitude from the period between MMCs to the peak of the MMC contraction. Both +/+ and W/Wv mice exhibited a significant increase in amplitude of phasic contractions during the MMC in the proximal, mid and distal ileum. F, in the +/+ mouse, the intervals between phasic contractions remained relatively constant from the transition between MMCs to the peak of the MMC (every ≈2 s). These intervals were not significantly different from one another (proximal, P = 0.64; mid, P = 0.74; distal, P = 0.50). However, in the W/Wv mouse, the proximal, mid and distal ileum exhibited a significant decrease in phasic contraction intervals from the transition between MMCs to the peak of the MMC (P = 0.006, P < 0.001 and P < 0.001, respectively).