
Figure 4. Ca2+ buffers reduce the apparent cooperativity of IP3 action.
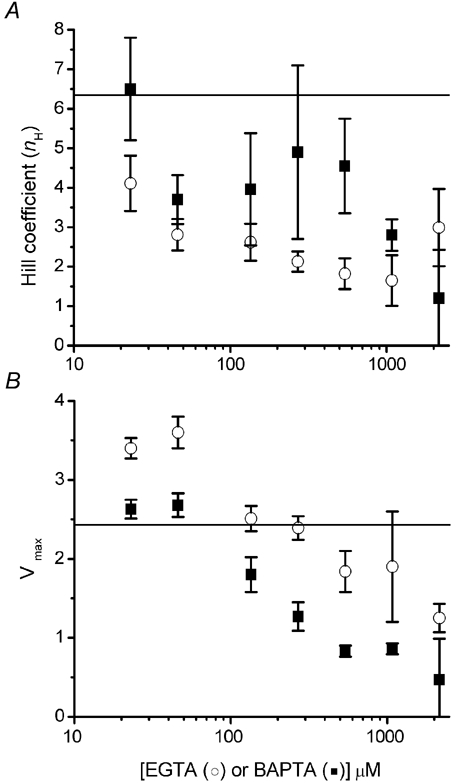
A, Hill coefficients, derived from the curves fitted to data in Fig. 3A and B, are plotted as functions of [EGTA] (open circles) and [BAPTA] (filled squares). B, plot shows Vmax (maximal fluorescence signal at infinite [IP3] derived from Hill-fits) as functions of [EGTA] (open circles) and [BAPTA] (filled squares). Horizontal lines on each graph represent control values (i.e. no exogenous buffer).