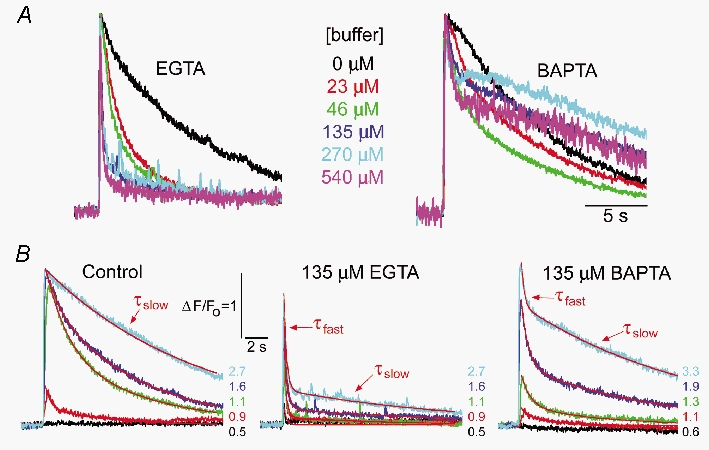
Figure 5. Ca2+ transients are speeded by EGTA but prolonged by BAPTA.

A, families of curves illustrate Ca2+ transients evoked by a fixed photolysis flash (normalized strength 2.5) in the presence of the indicated concentrations of EGTA (left) and BAPTA (right). Responses are scaled to same peak height to facilitate comparison. B, Ca2+ transients evoked by various photolysis flashes of various strengths (normalized strengths indicated) before loading buffer (left); in the same oocyte after loading 135 μm EGTA (middle); and in a different oocyte loaded with 135 μm BAPTA (right). Red curves illustrate fitting of single or double exponentials to derive fast (τfast) and slow (τslow) decay time constants.
