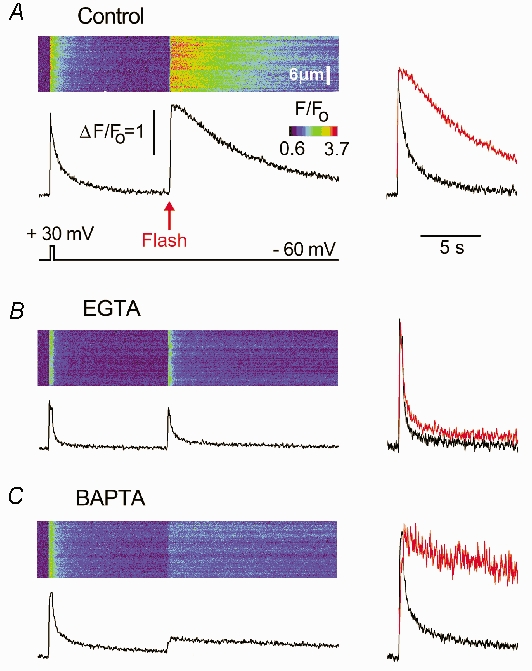
Figure 7. The decay of IP3-evoked Ca2+ transients is largely determined by the kinetics of Ca2+ release, not sequestration.

A, line-scan image shows a Ca2+ transient evoked by a 300 ms duration depolarization to +30 mV to activate expressed N-type channels, followed 10 s later by a UV flash to photorelease IP3. The lower trace shows the fluorescence profile averaged across a 6.6 μm region of the scan line, and superimposed traces on the right compare the voltage-gated signal (black) with the IP3-evoked signal (red) after normalizing to the same peak height. B, corresponding image and traces recorded under identical conditions in the same oocyte after loading 270 μm EGTA. C, similar records in a different oocyte loaded with 270 μm BAPTA. Control records in this oocyte before loading BAPTA were similar to one in A.
