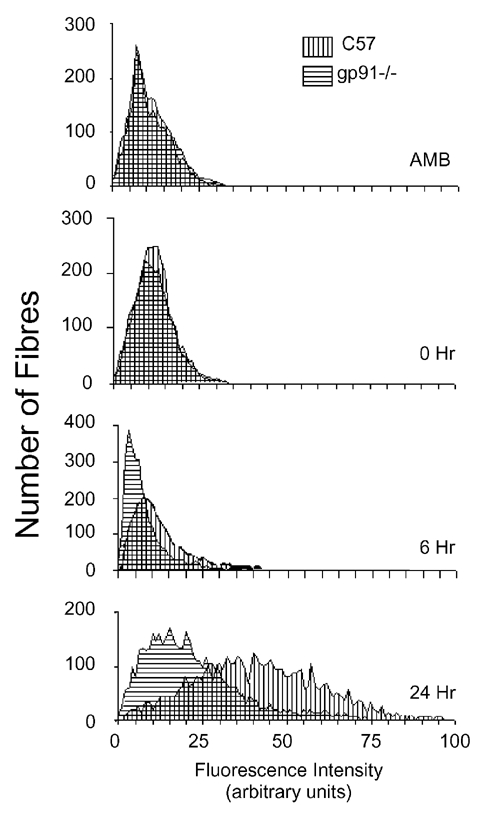
Figure 5. Frequency distributions of muscle fibres over the range of intensities of intracellular fluorescence.

Intracellular fluorescence was measured for individual fibres in entire cross-sections of soleus muscles from each treatment group (six animals per treatment group). Treatments consisted of ambulatory controls, animals experiencing 10 days of hindlimb unloading only (0 h), or 10 days unloading followed by 6 h (6 h) or 24 h reloading (24 h). A rightward shift of peaks on the abscissa indicates an increase in the frequency of fibres with muscle membrane lesions.
