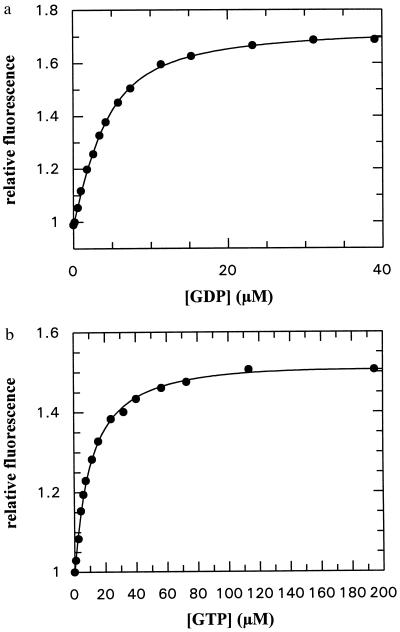
Figure 2.
(a) Titration of GDP with the NG fragment of FtsY (3.6 μM), using tryptophan fluorescence as a signal of binding (excitation wavelength 297 nm, detection at 340 nm). The solid line shows the fit to the data obtained by using the quadratic equation describing the binding equilibrium. The fitted Kd value was 2.14 ± 0.22 μM. Conditions were as described in the text. (b) Titration of GTP with the NG fragment of FtsY (1 μM). Conditions as in a. Fitted Kd value = 10.7 ± 0.45 μM.

