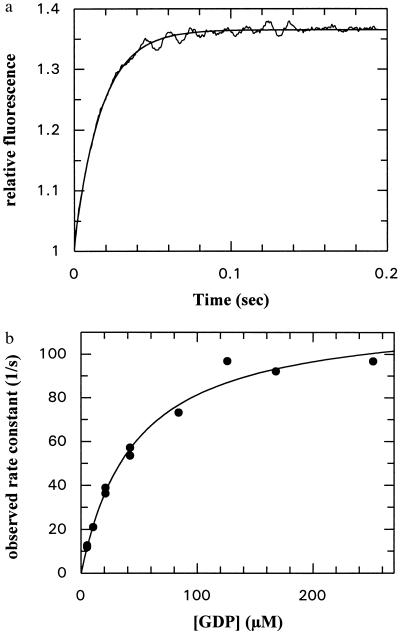
Figure 3.
(a) Time dependence of the association between GDP (42 μM) and the NG fragment of FtsY (2 μM) monitored by tryptophan fluorescence in a stopped-flow apparatus. The smooth line shows a single exponential fit to the data and corresponds to a pseudo-first-order rate constant of 56.8 ± 0.42 s−1. (b) Concentration dependence of the pseudo-first-order rate constant for GDP association to the NG fragment of FtsY. The solid line shows the best fit to a hyperbolic curve that defines the apparent Kd of GDP in the monitored step as 44.9 ± 9.3 μM and the maximal rate constant of the fluorescence change as 119 s−1.

