
Figure 1. Zinc deficiency reduces PCB77-induced CYP1A activity and CYP1A1 mRNA expression in vascular endothelial cells.
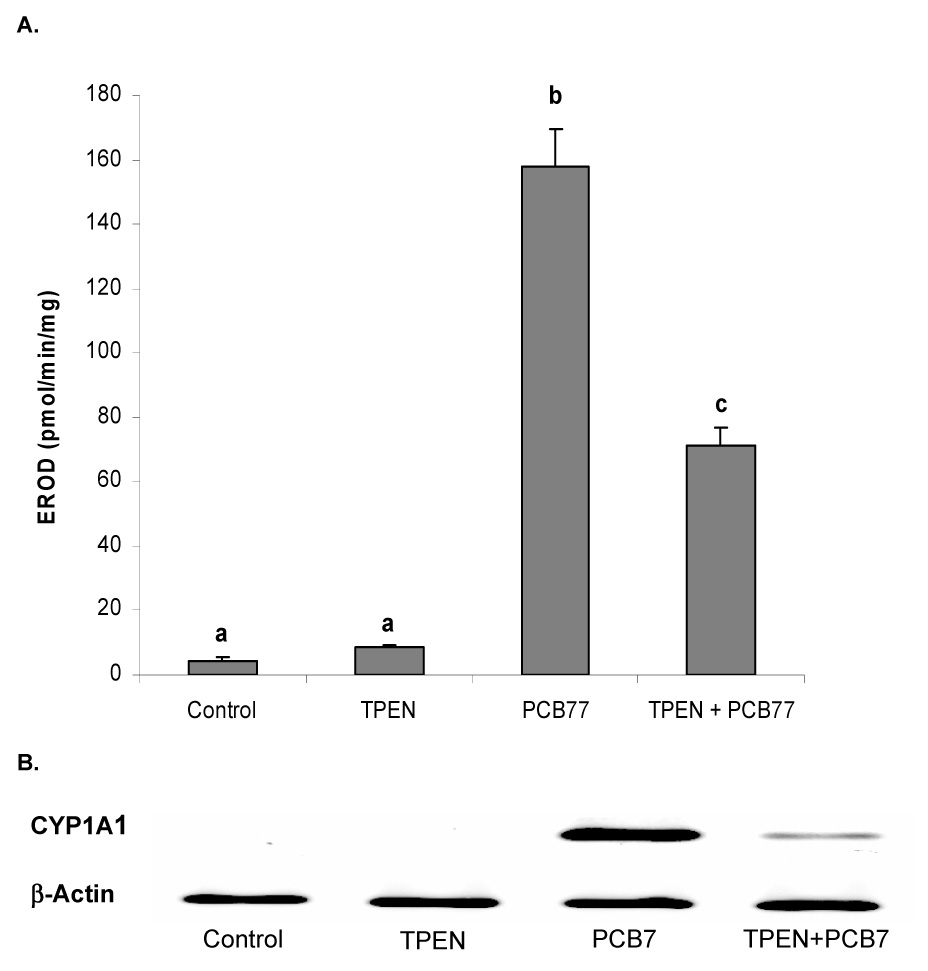
A. CYP1A activity measured by EROD assay. Cells were exposed to vehicle control (0.05 % of ethanol and 0.04 % of DMSO), TPEN (1.0 µM), PCB77 (0.04 µM), or TPEN (1.0 µM) plus PCB77 for 24 hours. Bars with different letters (a, b, c) are statistically different from each other (p < 0.05). n = 8. B. CYP1A1 mRNA expression measured by RT-PCR. Cells were exposed to vehicle control, TPEN, PCB77 (3.4 µM), or TPEN plus PCB77 for 24 hours. The figure is representative of the typical outcome of three repeated RT-PCR experiments.