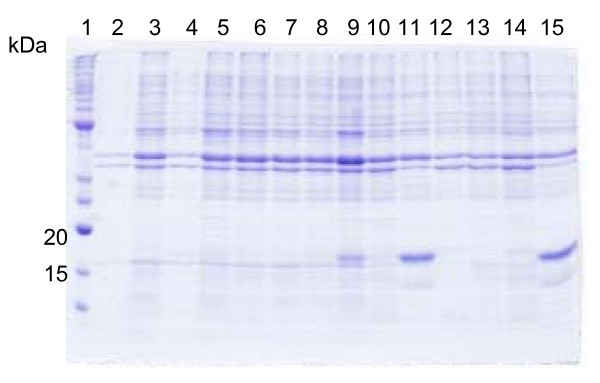
Figure 2.
Analysis of recombinant hG-CSF protein expression by SDS-PAGE. SDS-PAGE (12%) analysis showing the insoluble fractions of heterologous protein expression in E. coli BL21 (DE3) host cells transformed with either pET 23a(+) (control) or pET 23a(+)::hG-CSF. The best expression conditions were 24 h at 37°C without IPTG addition. Lane 1: Molecular mass markers (BenchMark™ Protein Ladder, Invitrogen), lanes 2,6,12: control induced with 0.4 mM IPTG and further growth for 3, 8 and 24 h respectively; lanes 3,7,13: control without induction and further growth for 3, 8 and 24 h respectively; lanes 4,8,10,14: host cells containing the recombinant pET 23a(+)::hG-CSF plasmid induced with 0.4 mM IPTG and further growth for 3, 8, 17 and 24 h respectively; and lanes 5,9,11,15: host cells containing the recombinant pET 23a(+)::hG-CSF plasmid without IPTG induction andd further growth for 3, 8,17 and 24 h respectively. The predicted molecular mass of rhG-CSF is 18.8 kDa.

