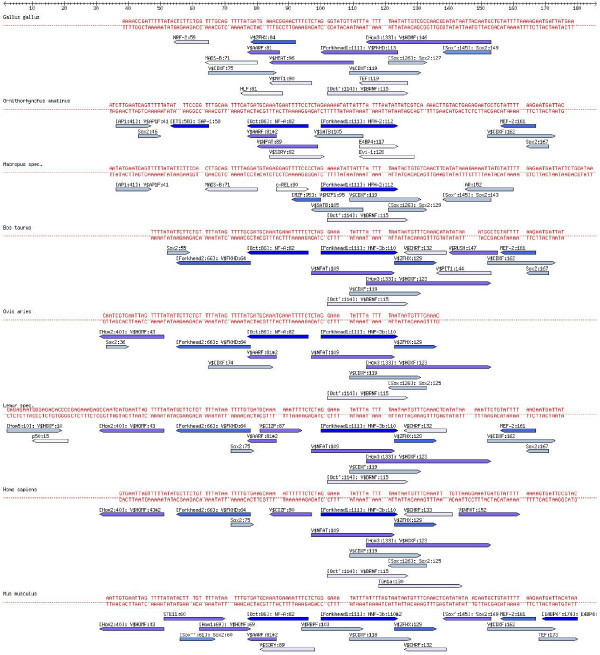
Figure 8.

Annotated alignment of the CFTR 3'UTR regulatory region. (UCSC data, see also Figure 13). In contrast to Figure 9, the TFBS predictions are not filtered further for Oct4, Sox2 and HOMF, only the standard filters apply. The color of the arrows denoting TFBSs reflect the E-Value, dark blue corresponding to the best, and white to the largest E-Value (i.e. to the E-Value threshold).
