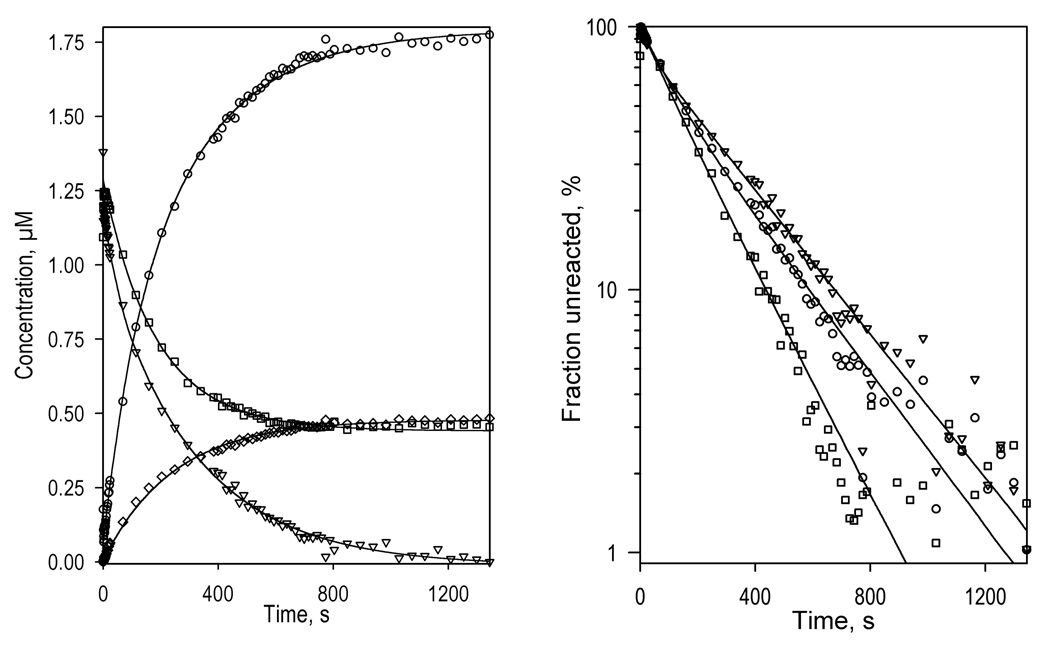
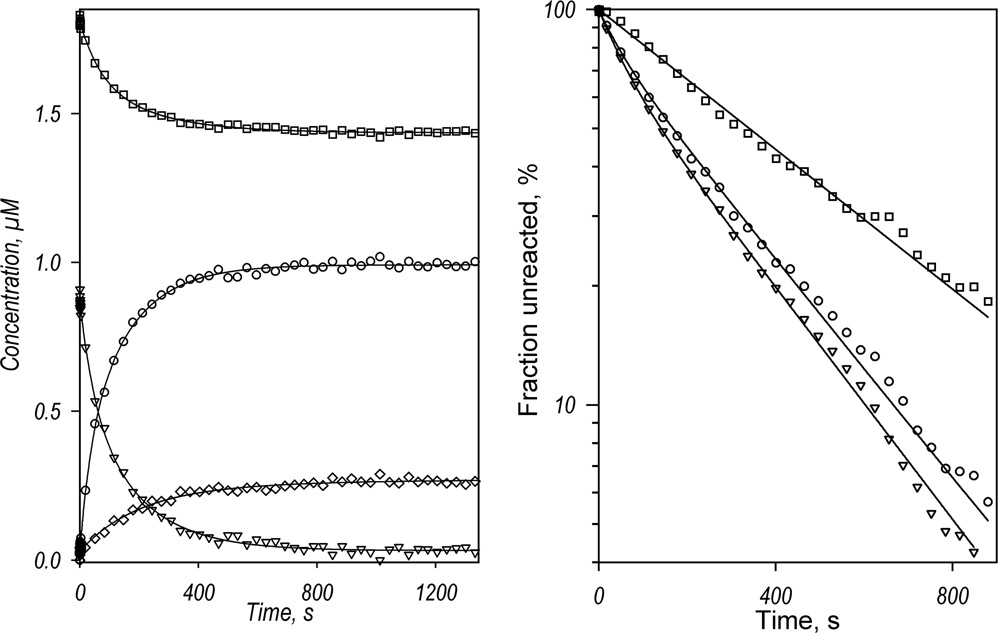
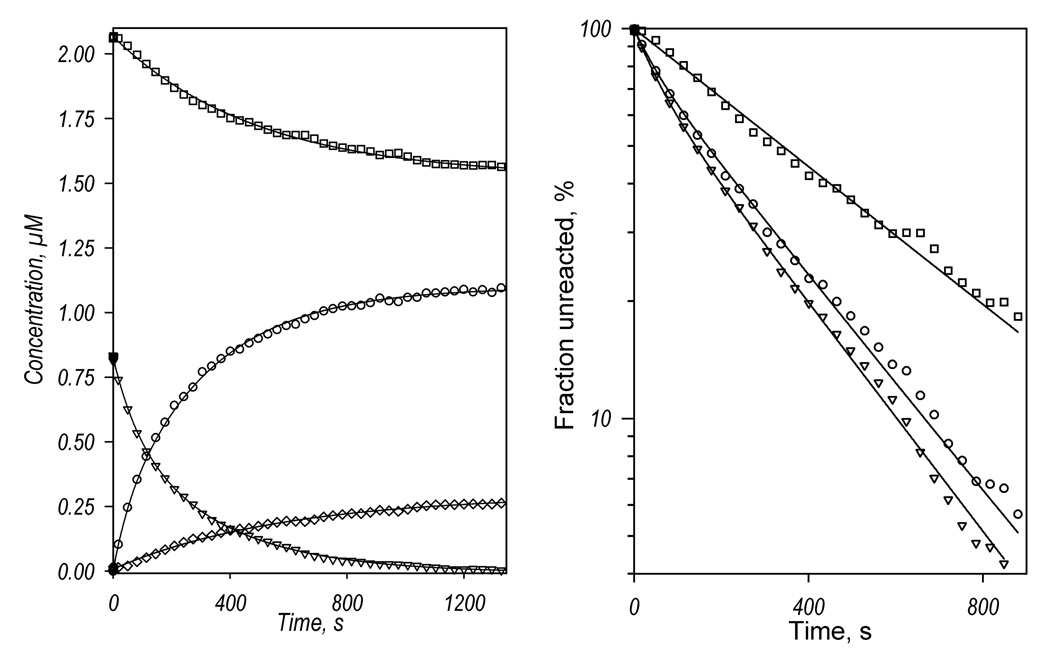
Fig. 3.
Kinetics of CYP3A4 reduction by BMR in the presence of bromocryptine (a), testosterone (b) and 1-pyrenebutanol (c). Left panels show the changes in the concentrations of the ferrous carbonyl complexes of CYP3A4 P450 (circles) and P420 (diamonds) states and the low-spin (squares) and the high-spin (triangles) states of ferric CYP3A4. Right panels show the curves for the ferric enzyme species and the ferrous P450 carbonyl complex in semi-logarithmic coordinates.


