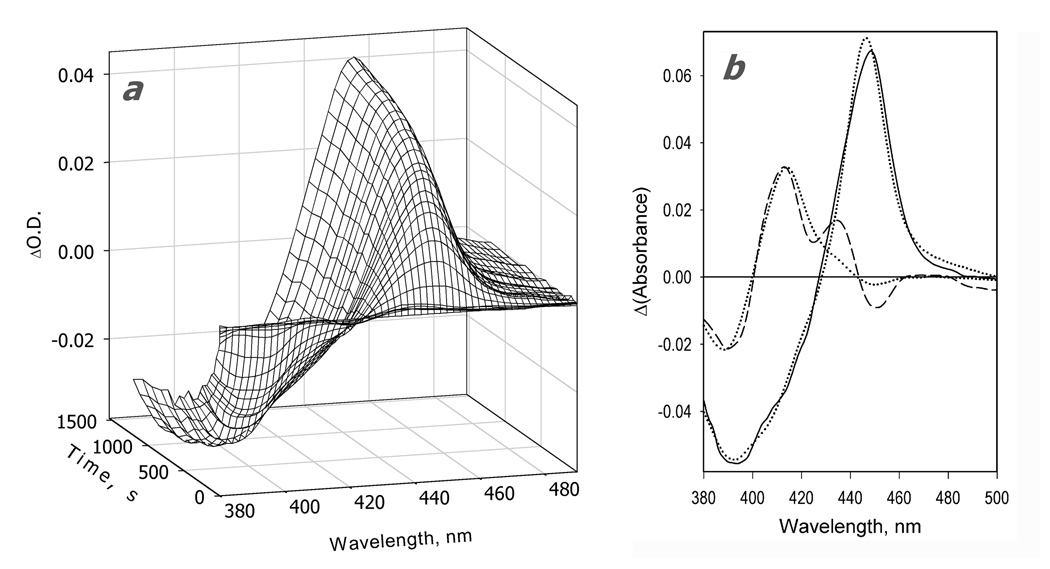
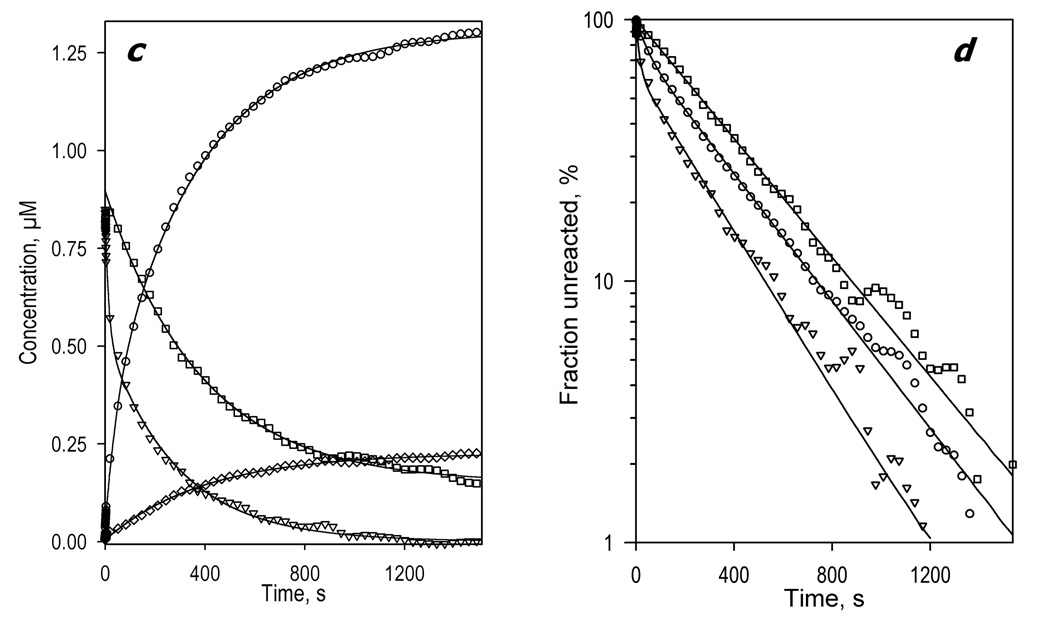
Fig. 4.
Kinetics of CYP3A4 reduction by BMR in the presence of ANF. The reaction mixture contained 1.75 µM 3A4, 3.5 µM BMR, and 25µM ANF. Other conditions as indicated in Fig. 2. a: Changes in absorbance in the Soret region during the reduction. The spectrum measured at time of origin is subtracted. b: The spectra of the first (solid line) and the second (dashed line) principal components of the observed changes found by PCA. The spectra are scaled to correspond to a transition in 1 µM heme protein. Dotted lines represent the approximation of the spectra by a combination of the CYP3A4 spectral standards. The time course of the changes in the concentrations of the ferrous carbonyl complexes of CYP3A4 P450 (circles) and P420 (diamonds) states and the low-spin (squares) and the high-spin (triangles) states of ferric CYP3A4 are shown in panel c. Panel d shows the curves for the ferric enzyme species and the ferrous P450 carbonyl complex in semi-logarithmic coordinates.


