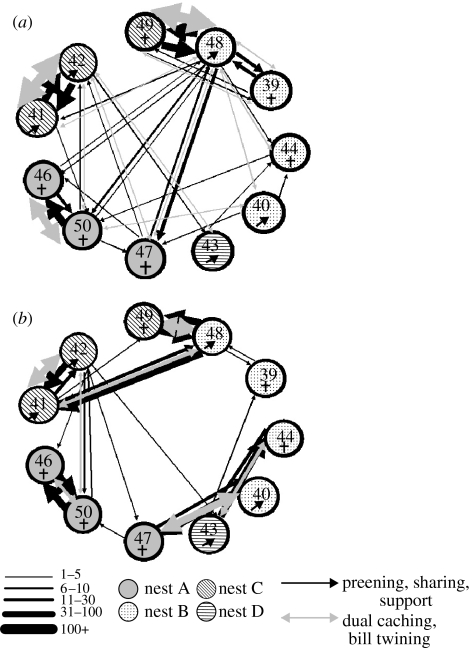
Figure 4.
Sociogram displaying the total frequency of affiliative behaviour between 11 hand-raised rooks (a) during Blocks 1–5, and (b) during Blocks 6–7. Numbers refer to individual birds (39, 40, 41, 42, 43, 44, 46, 47, 48, 49 & 50). The thickness of the lines represents the total frequency of affiliative behaviour across the time period represented. Black line represent unidirectional behaviours (food sharing, social support and allopreening), and the grey lines represent bidirectional behaviours (dual caching and bill-twining). The different patterned circles represent the nest from which the nestling was taken (A–D).

