
Figure 2.
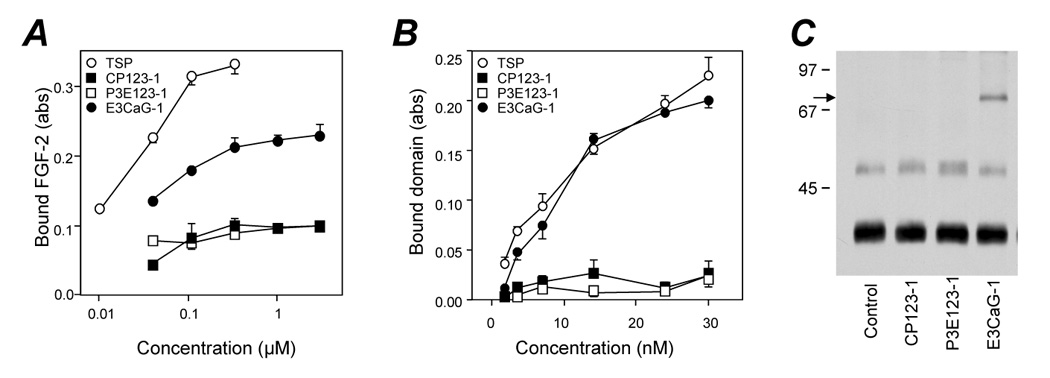
FGF-binding ability of CP123-1, P3E123-1, and E3CaG-1. A) Binding of labeled FGF-2 to plastic coated with increasing concentrations of TSP-1 or TSP-1 fragment. B) Binding of labeled TSP-1 or fragments, at the indicated concentrations, to immobilized FGF-2. Data are the amount of bound FGF-2, as absorbance (Abs), mean and SD of triplicates. C) Formation of the complex between FGF-2 and the indicated TSP-1 fragment in solution. Samples were analyzed in Western blot. Arrow indicates the putative FGF-2/E3CaG-1 complex. Molecular weight markers (in kDa) are on the left. Experiments in A were done in calcium-free buffers, in B calcium concentration was < 0.1 mM.