
Figure 3. TE-expressed sAg differentially affect CD4+ T cell development.
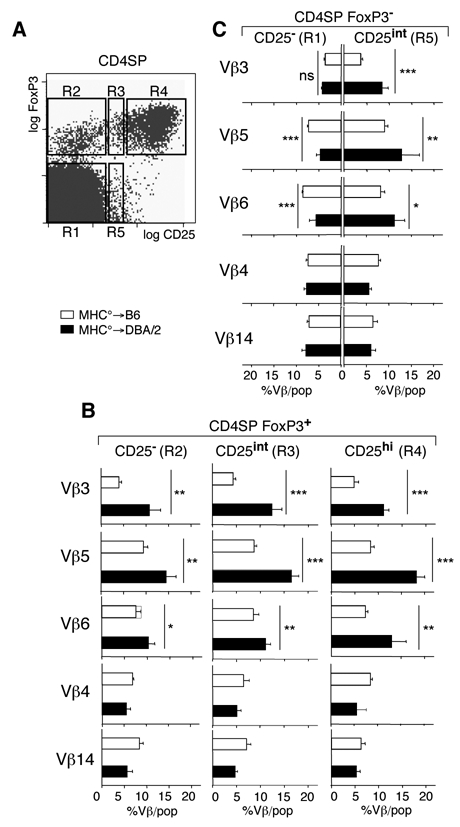
(A) Electronically gated CD4SP thymocytes were subdivided into five different populations according to their CD25 and Foxp3 expression levels. (B). Percentages of thymocytes expressing indicated Vβ among the CD4SP Foxp3+ thymocyte subpopulations indicated in the distinct chimeras. (C) Percentages of thymocytes expressing indicated Vβ among CD25− and CD25+ CD4SP Foxp3− thymocyte subpopulations in the distinct chimeras. ***, p<0.001; **, p<0.01; *, p < 0.05; ns, not significant; Student’s t test. Error bars indicate SD (n≥4).