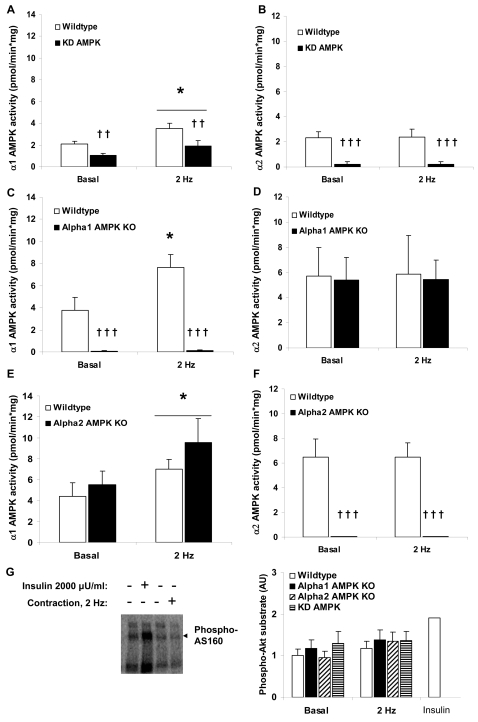
Figure 3. Twitch-contraction (0.1 ms, 2 Hz, 2 min) signaling in AMPK transgenic soleus muscles.
A) α1 AMPK and B) α2 AMPK activities in wildtype vs. kinase-dead (KD) AMPK muscles (n = 7–8), C ) α1 AMPK and D) α2 AMPK activities in wildtype vs. α1 AMPK KO muscles (n = 7–10), E ) α1 AMPK and F) α2 AMPK activities E) and F) wildtype vs. α2 AMPK (n = 10). G) Basal and twitch-stimulated AS160 phosphorylation in wildtype vs. AMPK transgenic muscles (n = 6–9). As a positive control, insulin-stimulated (2000 µU/ml, 15 min) soleus was included (n = 1). * p<0.05 vs. basal. ††/††† p<0.01/0.001 genotype main effect.

