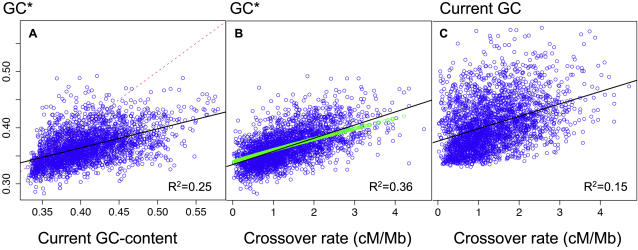
Figure 1. Correlations between the stationary GC-content (GC*), the current GC content and the crossover rate in human autosomes.
Each dot corresponds to a 1 Mb-long genomic region. (A) GC* vs. current GC-content. The dashed line indicates the slope 1. (B) GC* vs. crossover rate (HAPMAP). Green dots correspond to the predictions of the BGC model (model M1, N = 10,000) (C) Current GC-content vs. crossover rate. Regression lines and Pearson's correlation R2 are indicated.

