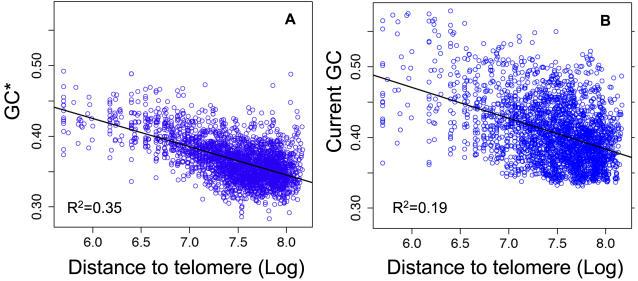
Figure 2. Correlations between the stationary GC-content (GC*), the current GC content and the distance to telomeres in human autosomes.
Each dot corresponds to a 1 Mb-long genomic region. (A) GC* vs. LDT (Log distance to telomere in bp). (B) Current GC-content vs. LDT. Regression lines and Pearson's correlation R2 are indicated.

