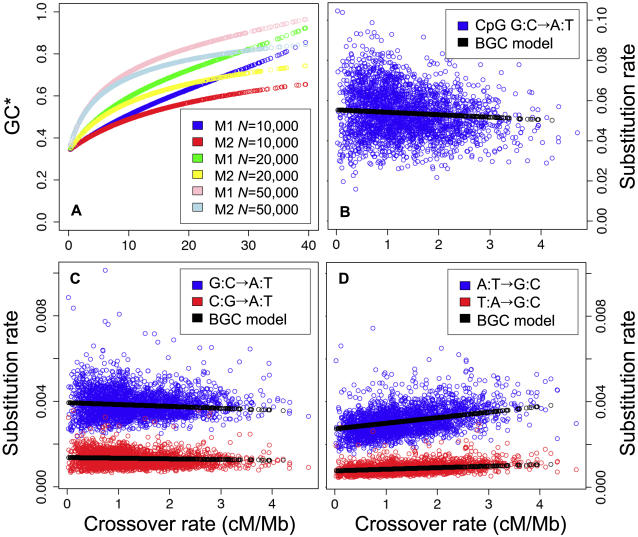
Figure 5. Predictions of the BGC model and comparison with observed data in human autosomes.
(A) Predicted GC* vs. crossover rate for different parameters of the BGC model (M1 or M2 (see text)) and different effective population sizes (N). (B–D) Correlations between base-specific substitution rates and crossover rates in human autosomes (1 Mb windows). Blue and red dots: observed data. Black dots: predictions of the BGC model (Model M1, N = 10,000).

