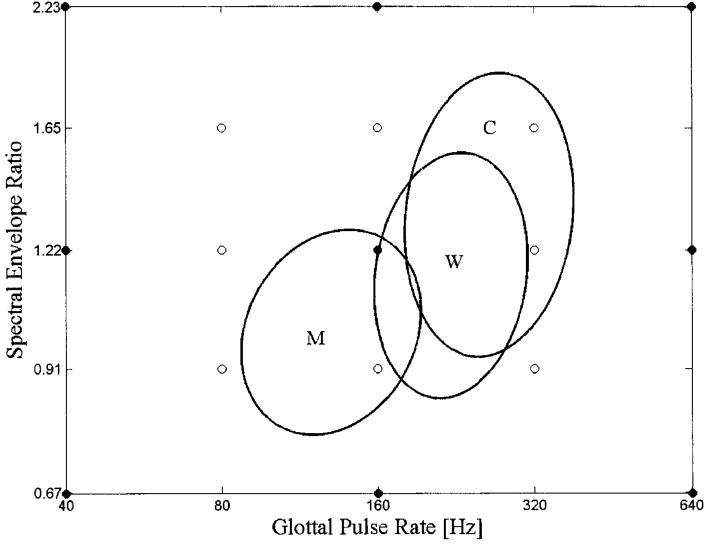
FIG. 1.
Combinations of GPR and SER values used in the experiments on speaker size discrimination. Discrimination performance was measured at nine points (solid circles) in the single-vowel experiment, and at 17 points (solid and open circles) in the speech-like experiment. The three ellipses show estimates of the normal range of GPR and SER values in speech for men (M), women (W), and children (C), derived from the data of Peterson and Barney (1952). In each category 90% of individuals would be expected to fall within the respective ellipse.

