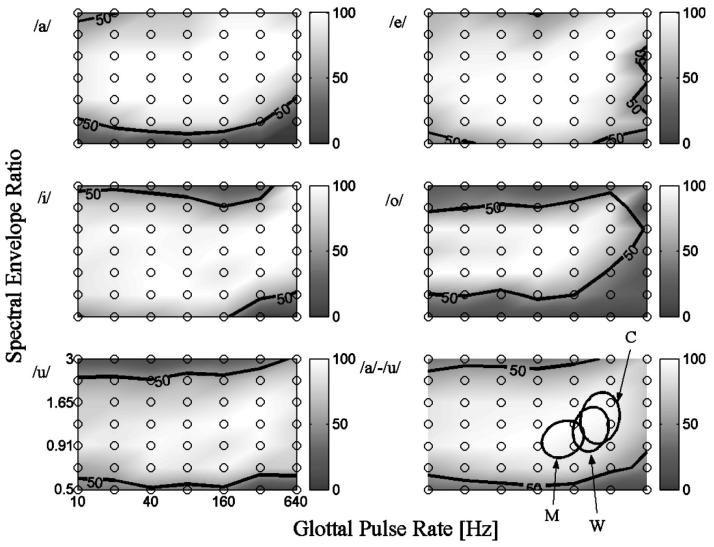
FIG. 6.
Vowel recognition performance using the surface paradigm. The data are presented as a 2D surface plot with gray tone showing mean percent correct. Sample points are shown as circles with interpolation between data points. The means represent 10 trials from each of 5 listeners. The data averaged across all five vowels are shown in the bottom-right panel (250 trials/point). The thick black contour marks recognition threshold (50%, d′=1.0) in our 5AFC experiment. The three ellipses (bottom-right panel) show the range of GPR and SER in speech for men, women, and children (derived from Peterson and Barney, 1952).

