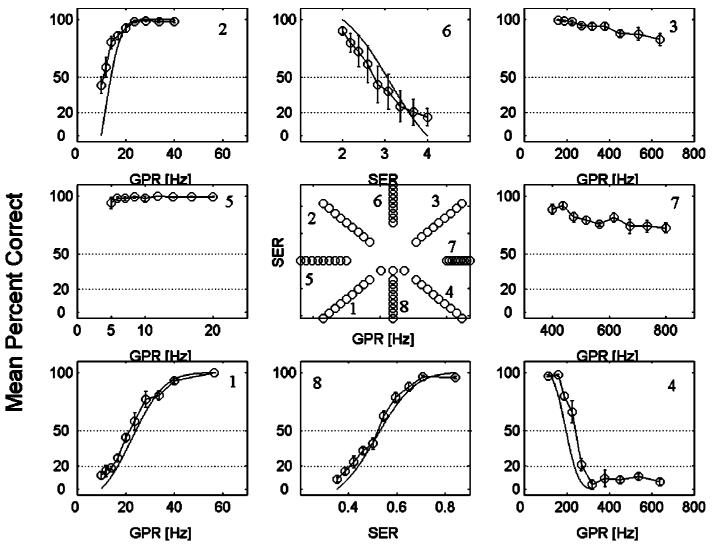
FIG. 8.
Vowel recognition performance using the strip paradigm. Data collapsed across all five vowels and all five listeners. Each data point is based on 250 trials. Smooth curves are best-fitting cumulative Gaussians and have been used where appropriate. The center panel shows the GPR-SER values for all eight strips. For other details cf. Fig. 3.

