Figure 2.
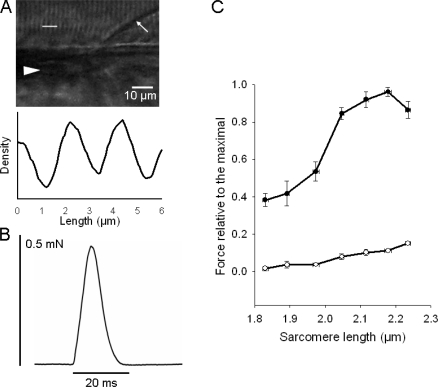
Sarcomere pattern, single twitch contraction and length force relationships. (A) High magnification photograph showing sarcomere patterns and the corresponding density record from the segment indicated with the white line in the photograph. Arrow indicates myoseptum, triangle indicates notochord. The approximate location of this area is indicated in Fig. 1 B showing a picture from a similar preparation. (B) Original recording of a single twitch elicited by electrical stimulation. (C) Relationship between sarcomere length and passive (open circles) and active (filled circles) force. Force values are expressed relative to the maximal active force, n = 7.

