Figure 4.
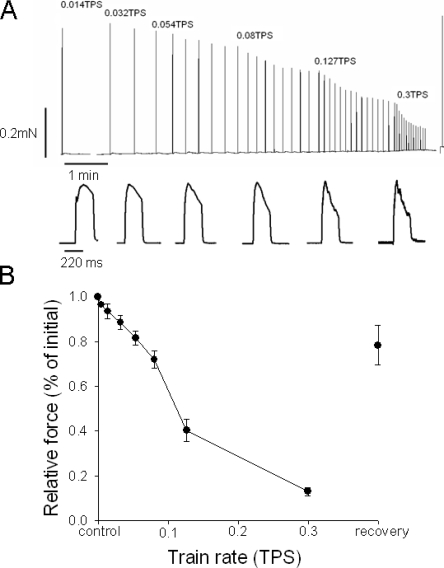
(A) Original force recording of zebrafish larvae preparation stimulated with short tetani at increased train rate (top). Representative individual tetanic force responses at the different train rates are displayed below in the bottom panel. To show the shape of the contractions in the records the peak forces were scaled to similar amplitude. Absolute force amplitude is displayed in the top panel. (B) Mean values of tetanic force at different train rates (trains per second), n = 9.

