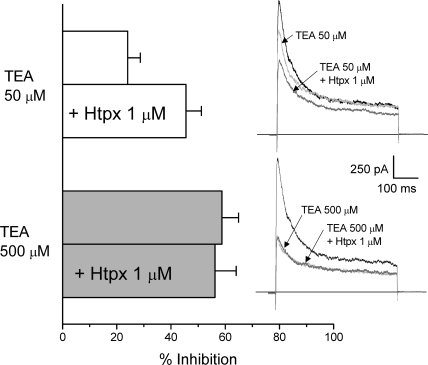
Figure 2.
Occlusion by TEA of the effect of HpTx in CB chemoreceptor cells. The bar plot shows the reduction in the peak current amplitude in depolarizing pulses to +40 mV induced by the application of 50 μM TEA (white bars) or 500 μM TEA (gray bars) alone or in combination with 1 μM HpTx as indicated. Traces on the right show representative examples in each situation. Data are mean ± SEM of six cells in which the whole protocol has been applied.

