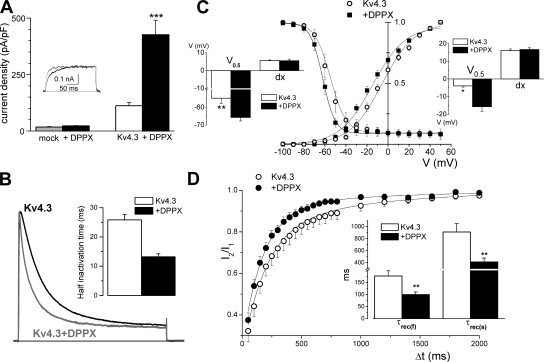
Figure 4.
Effects of DPPX coexpression on the kinetics of Kv4.3 currents in HEK cells. (A) Average current density obtained in HEK cells in the four situations indicated: mock transfected (n = 8; gray bar), transfected with DPPX alone (n = 10; black bar), with Kv4.3 alone (n = 23; white bar), or with Kv4.3+DPPX (n = 47; black bars). Data are mean ± SEM, ***, P < 0.001. The inset shows traces obtained in a depolarizing pulse to +40 mV in a mock transfected cell (gray trace) or in a DPPX-transfected cell (black line). (B) Cotransfection of DPPX produced an acceleration of inactivation of Kv4.3 currents in HEK cells. The figure show normalized representative traces obtained in a Kv4.3 (black line) and a Kv4.3+DPPX transfected cell (gray trace) during 200-ms pulses to +40 mV. The speed of inactivation was quantified by analyzing the time in which the current amplitude decays to 50% of the peak amplitude (half inactivation time). The inset shows the average half inactivation time obtained in outside-out macropatches in the two conditions. n = 18 for Kv4.3 patches and n = 13 for Kv4.3+DPPX patches. (C) Normalized steady-state inactivation and conductance–voltage relationship obtained in HEK cells expressing Kv4.3 alone (open circles) or together with DPPX (closed squares). Steady-state inactivation was studied by measuring the amplitude of 500-ms pulses to +40 mV preceded by 6.5-s prepulses to potentials between −100 and +40 mV in 10-mV steps. The time between episodes was 30 s. The peak conductance–voltage relationship was calculated from the current–voltage relationship obtained in the prepulses by using the equation G = I/(Em – Erev), where I is the peak current, Em is the command voltage, and Erev is the reversal potential. Normalized peak conductance–voltage curves and steady-state inactivation curves were fitted using Boltzmann functions. Each point represents the mean ± SEM of seven individual determinations. The insets show the mean of the slopes (dx) and the voltages (V0.5) for half-inactivation (left inset) or half-activation (right inset) obtained by averaging the Boltzmann fits of each individual cell. *, P < 0.05; **, P < 0.01. (D) The recovery from inactivation was studied with a two-pulse protocol in which two depolarizing pulses to +40 mV from a holding potential of −80 mV were applied with a variable interpulse interval at −80 mV, and the amplitude of the second pulse (I2) relative to the first one (I1) is plotted against the interpulse interval. Each point is the mean ± SEM of seven cells in each condition, and the continuous lines show the fit of the data to a biexponential function. The mean of the fast (τf) and slow time constants (τs) obtained in the individual fits are shown in the inset. **, P < 0.01.

