Figure 5.
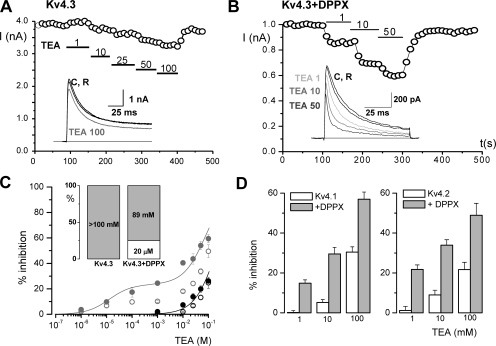
TEA block of Kv4.3 and Kv4.3+DPPX channels in HEK cells. The effect of TEA was determined by studying the changes in the amplitude of the currents elicited by depolarizing pulses to +40 mV upon application of increasing TEA concentrations to the bath solution. An example of the changes in the peak current amplitude of a Kv4.3 (A) and a macropatch from a Kv4.3+DPPX transfected cell (B) is plotted. Representative current traces at the indicated TEA concentrations are shown in the insets. (C) Dose–response curves for the effect of TEA on Kv4.3 (black circles) and Kv4.3+DPPX currents (gray circles). The filled symbols represent the TEA-sensitive fraction calculated as 100 × (AControl − ATEA)/AControl, where A is the integral of the current elicited by the depolarizing pulse. The lines represent the fit of the data to a hyperbolic function with one binding site for TEA (in the case of Kv4.3) or two binding sites in the case of Kv4.3+DPPX (see legend to Fig. 1 for equation, i = 2). Data points are mean ± SEM. The open symbols show the inhibitory effect of TEA on the peak current amplitude in both cases (Kv4.3 alone or Kv4.3+DPPX) calculated as in Fig. 1 B. (D) Inhibitory effect of TEA on Kv4.1 and Kv4.2 channels, alone or in combination with DPPX. The bar plots show the percent inhibition of the current integral at +40 mV obtained at three different TEA concentrations (1, 10, and 100 mM). Data are mean ± SEM of 9–12 cells in each condition.

