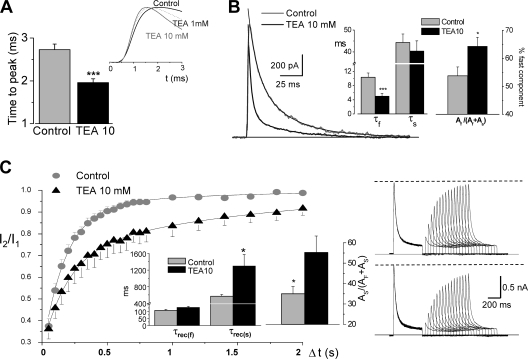
Figure 6.
Modulation by TEA of the kinetics of Kv4.3+DPPX channels. (A) Speed of activation was studied in depolarizing pulses to +40 mV in outside-out macropatches, and was calculated as the time to peak current amplitude. The traces in the figure show normalized currents obtained in one representative cell in control (black line) and in the presence of 1 mM TEA (dotted line) and 10 mM TEA (gray line). The bar plot shows the mean data from 15 patches in control and in the presence of 10 mM TEA. ***, P < 0.001 for paired data. (B) The time course of inactivation of the current elicited in 200-ms depolarizing pulses to +40 mV was fitted to a biexponential function both in control and in the presence of TEA (10 mM). The figure shows two representative traces from a macropatch together with their corresponding fits. The bar graphs display the inactivation time constants (τs and τf) and the relative amplitude of the fast component obtained in control and in the presence of 10 mM TEA. Mean ± SEM of 14 cells. *, P < 0.05; ***, P < 0.001 for paired data. (C) Recovery from inactivation at −80 mV in the presence of 10 mM TEA determined with the same double pulse protocol described in Fig. 3 D. The two time constants (τrec(s) and τrec(f)) and the proportion of the slow component As, are the mean ± SEM of the individual fit of five Kv4.3+DPPX-transfected cells in both conditions (control and 10 mM TEA). *, P < 0.05. Representative traces obtained in a cell in control conditions (top traces) and in the presence of TEA 10 mM (bottom traces) are also shown in the right panels.

