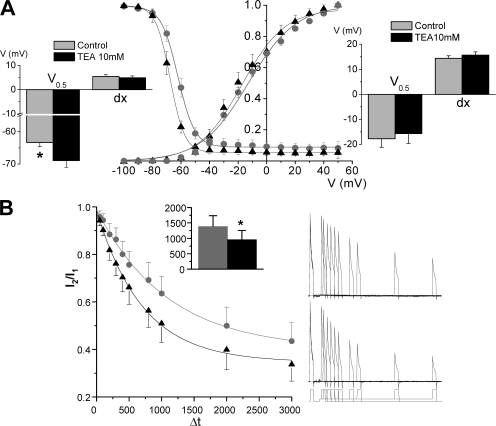
Figure 7.
TEA affects steady-state properties of Kv4.3+DPPX currents. (A) Voltage dependence of peak conductance and steady-state inactivation before (gray circles) and after 10 mM TEA application (black triangles). The curves were obtained and analyzed as described in Fig. 4 C. The bar plots show the data obtained from averaging the midpoint (V0.5) and the slope (dx) of the Boltzmann fits of each individual cell for steady-state inactivation (left) and peak conductance–voltage relationship (right). n = 7 cells in each group; *, P < 0.05. (B) Time course of the closed-state inactivation of Kv4.3+DPPX channels before and after application of 10 mM TEA. Examples of the protocol used and the current traces obtained in both conditions are shown in the right panels of the figure. In brief, a 100-ms depolarizing pulse to +40 mV from a holding potential of −80 mV was delivered to obtain the control current, and this pulse was followed to a return to −80 mV during 6 s to allow full channels recovery. After this, the voltage was stepped to a variable length prepulse potential of −55 mV before depolarizing again to +40 mV during 100 ms to determine the fraction of available channels. The normalized relationship of the peak current amplitude in the two depolarizing pulses (I2/I1) is plotted against the duration of the prepulse, and a single exponential function was used to fit the data. The inset shows the mean time constants obtained in the individual fits of the cells before and after TEA application. *, P < 0.05 for paired data; n = 5 cells.

