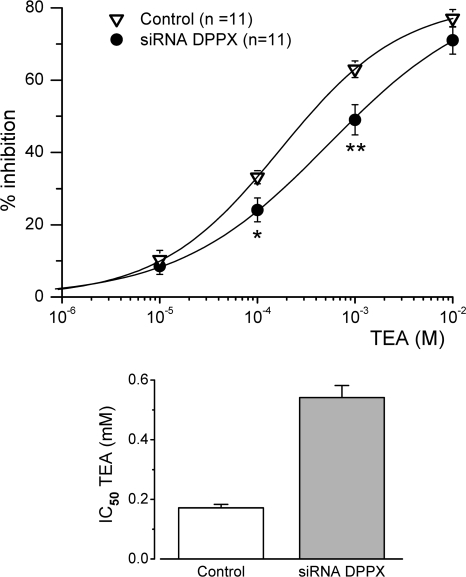
Figure 9.
Effect of DPPX down-regulation on the TEA sensitivity of the transient K+ current of rabbit CB chemoreceptor cells. The effect of TEA is represented as percentage of inhibition, and was calculated from the reduction in the peak current amplitude in depolarizing pulses to +40 mV as described in Fig. 1. Control (open triangles) represents pooled data from untransfected, GFP-electroporated, and GFP+ negative control siRNA-electroporated CB cells. Each point is the average of 11 cells in each group. The continuous lines show the fit of the data to a hyperbolic function with one binding site for TEA. *, P < 0.05; **, P < 0.01. The estimated IC50 for TEA was calculated from the average of the Bmax values obtained from the fit of each individual cell and is shown in the bar plot on the right.

