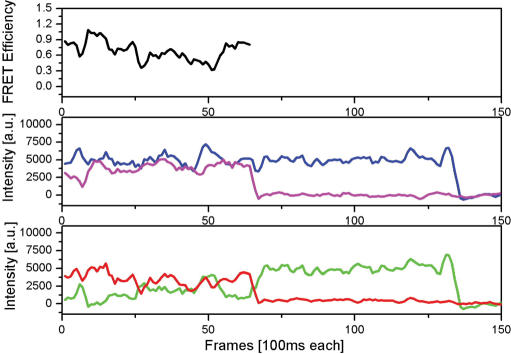
Figure 5.
Single-pair FRET data reveals conformational changes in real time. The detected fluorescence intensity of the donor (green) and acceptor (red) show strong fluctuations with time, resulting in variations of FRET efficiency (black). At the same time the total intensity (blue) is rather constant. Direct excitation of the acceptor molecule (magenta) furthermore shows that the dynamics in the FRET signal are not caused by transient acceptor dark states. After 65 frames the acceptor photobleaches and therefore no more FRET values are computed beyond this time point. After 130 frames, the donor bleaches as well.

