
Figure 2.
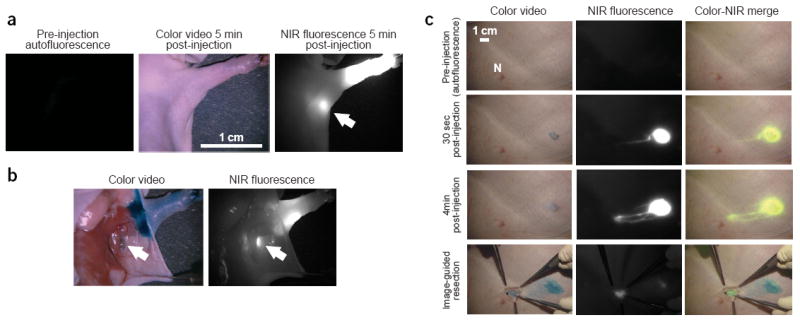
NIR QD sentinel lymph node mapping in the mouse and pig. (a) Images of mouse injected intradermally with 10 pmol of NIR QDs in the left paw. Left, pre-injection NIR autofluorescence image; middle, 5 min post-injection white light color video image; right, 5 min post-injection NIR fluorescence image. An arrow indicates the putative axillary sentinel lymph node. Fluorescence images have identical exposure times and normalization. (b) Images of the mouse shown in a 5 min after reinjection with 1% isosulfan blue and exposure of the actual sentinel lymph node. Left, color video; right, NIR fluorescence images. Isosulfan blue and NIR QDs were localized in the same lymph node (arrows). (c) Images of the surgical field in a pig injected intradermally with 400 pmol of NIR QDs in the right groin. Four time points are shown from top to bottom: before injection (autofluorescence), 30 s after injection, 4 min after injection and during image-guided resection. For each time point, color video (left), NIR fluorescence (middle) and color-NIR merge (right) images are shown. Fluorescence images have identical exposure times and normalization. To create the merged image, the NIR fluorescence image was pseudocolored lime green and superimposed on the color video image. The position of a nipple (N) is indicated.