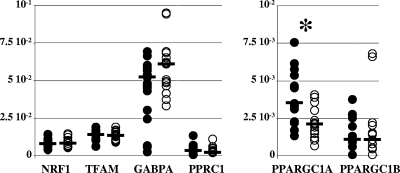
FIG. 3.
The increased mitochondrial population was not explained by the increase of transcription factors involved in mitochondrial biogenesis. The steady-state levels of mRNA from all known genes encoding transcription factors involved in mitochondrial biogenesis are expressed as cDNA copies, normalized to the β-actin cDNA level. The closed circles show values for control samples, and the open circles show values for patients' samples. The median value of each group of data is shown as a bar. The asterisks mark statistically significant differences between results for pathological and control samples. The patients' and control samples had similar levels of NRF1 (8.35 × 10⁻³ in patients' samples versus 8.23 × 10⁻³ in controls; P = 0.74), of TFAM (1.35 × 10⁻² in patients' samples versus 1.44 × 10⁻² in controls; P = 0.71), of GABPA (also known as NRF2) (6.12 × 10⁻² in patients' samples versus 5.25 × 10⁻² in controls; P = 0.21), of PPRC1 (also known as PGC1-related coactivator [PRC]) (3.81 × 10⁻³ in patients' samples versus 5.07 × 10⁻³ in controls; P = 0.61), and of PPARGC1B (also known as PERC or PGC1β) (1.50 × 10⁻³ in patients' samples versus 1.34 × 10⁻³ in controls; P = 0.89). The amount of PPARGC1A (also known as PGC1α) was significantly decreased in patients' samples (2.13 × 10⁻³ versus 3.55 × 10⁻³ in controls; P < 0.01).

