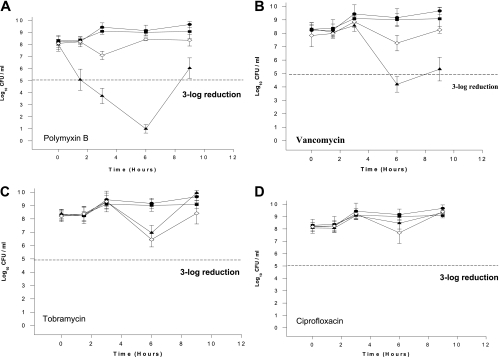
FIG. 3.
In vitro growth and killing curves of Pseudomonas aeruginosa 100609 exposed to three antibiotics antagonized or not affected by PEI. •, control growth curve of the strain in the absence of antibiotics and PEI; ▪, growth curve with PEI (250 μg/ml); ▴, growth curve with antibiotic (25% of the MIC); and ⋄, growth curve with antibiotic (25% of MIC) and PEI (250 μg/ml). Data are the means ± standard deviations of an experiment performed in triplicate.

