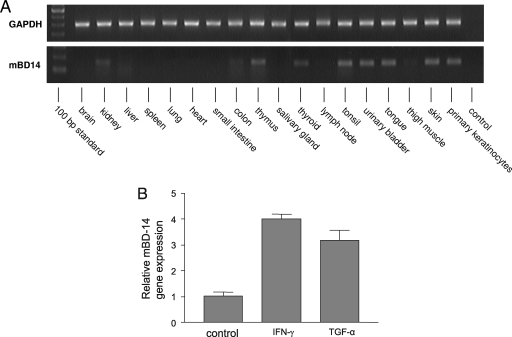
FIG. 2.
Analysis of mBD-14 gene expression. (A) Reverse transcription-PCR analysis of mBD-14 and glycerolaldehyde-3-phosphate dehydrogenase (GAPDH) gene expression in various tissues. The following intron-spanning primers were used: mBD-14, forward primer, 5′-TCTTGTTCTTGGTGCCTGCT-3; reverse primer, 5′-CGACCGCTATTAGAACATCGAC-3′; GAPDH, forward primer, 5′-TGTTCCTACCCCCAATGTGT-3; reverse primer, 5′-TGTGAGGGAGATGCTCAGTG-3. (B) Mouse primary keratinocytes were stimulated with IFN-γ or TGF-α (50 ng/ml) for 24 h, and mBD-14 mRNA expression was analyzed by real-time PCR using the primers for mBD-14 and GAPDH as shown above. Bars represent the relative mBD-14 transcript levels normalized to GAPDH transcript levels. Results are from one representative experiment of three independent experiments and are presented as means ± standard deviations.

