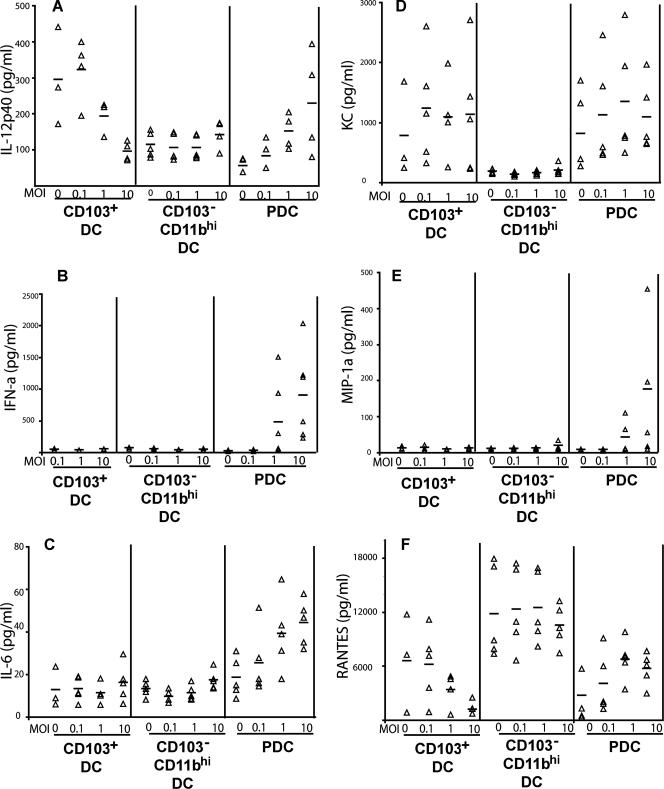
FIG. 6.
Cytokine and chemokine production by RDC subsets after influenza virus infection. The three RDC subsets in Fig. 4A and B were isolated and infected as indicated in Materials and Methods. At 22 h p.i., supernatants were harvested and the amounts of cytokines and chemokines were measured using the Bio-plex cytokine assay. IFN-α production was measured with an IFN-α ELISA kit. The triangles represent the values of individual experiments for the indicated cytokines and chemokines from RDC, and the mean values are indicated by the bars (n = 3 to 5).

