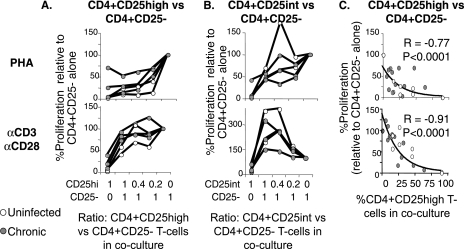
FIG. 3.
CD4+CD25high T cells from HCV-infected and uninfected subjects display similar levels of dose-dependent suppression following polyclonal stimulation. (A and B) Proliferative capacities of CD4+CD25− responder cells alone and with autologous FACS-sorted CD4+CD25+ T-cell subsets following PHA or anti (α)-CD3/anti-CD28 stimulation at CD25+/CD25− T-cell ratios of 1:0, 1:1, 0.4:1, 0.2:1, and 0:1. The y axis shows the SIs from CD25+/CD25− cocultures divided by the SI from CD4+CD25− T cells stimulated alone. The graphs represent data from three chronically HCV-infected and two uninfected control subjects. (C) Percent proliferation (relative to that for CD4+CD25− responder T cells stimulated alone) shows a tight inverse correlation with the actual CD4+CD25high T-cell content in each coculture. Values were calculated based on the purity of the FACS-sorted CD4+CD25high subset. (Top) PHA. (Bottom) Anti-CD3/anti-CD28.

