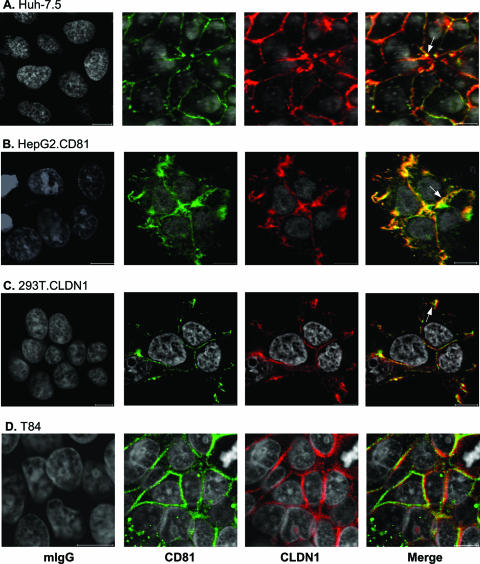
FIG. 1.
CD81 and CLDN1 colocalization. Huh-7.5 (A), HepG2.CD81 (B), 293T.CLDN1 (C), and T84 cells (D) were grown on poly-l-lysine-treated glass coverslips and stained with normal mouse IgG (mIgG) or antibodies specific for CD81 (M38) and CLDN1 (1C5-D9). Bound antibodies were visualized using the Alexa Fluor 488 anti-mouse IgG1 (M38; green) and Alexa Fluor 633 anti-mouse IgG2a (1C5-D9; red). LSCM images were obtained using a 63× 1.2-NA objective (the scale bar represents 10 μm). Areas of CD81-CLDN1 colocalization at CJs are labeled with an arrow. Cells were inoculated with HCVpp to define their permissiveness for viral entry. HCV-specific infectivity levels (expressed in relative light units [RLU]) were as follows: for Huh-7.5 cells, 139 × 104 RLU; for HepG2-CD81 cells, 9 × 10⁴ RLU; for 293T-CLDN1 cells, 14 × 104 RLU; and for T84 cells, 0.2 × 10⁴ RLU.

