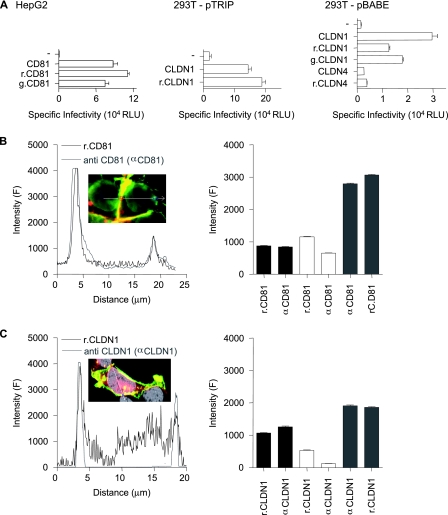
FIG. 2.
Characterization of fluorescently N terminus-tagged CD81 and CLDN1. (A) HepG2 and 293T cells were transduced with retroviral vector pTRIP or pBABE expressing CD81, r.CD81, g.CD81, CLDN1, r.CLDN1, g.CLDN1, CLDN4, or r.CLDN4 and infected with HCVpp-H77, MLVpp, or Env−pp. Data are expressed as levels of specific infectivity and represent the mean luciferase levels (relative light units [RLU]) determined from replicate infections, with the Env−pp value subtracted (270 RLU for HepG2 cells and 360 RLU for 293T cells). HepG2 cells expressing r.CD81 (B) or 293T cells expressing r.CLDN1 (C) were stained with antibodies specific for CD81 (anti-CD81 [αCD81]) or CLDN1 (anti-CLDN1 [αCLDN1]), respectively. Linear profiling of the fluorescence signal emitted by the tagged protein (black line) and the indirect fluorescence signal from antibody staining (gray line) is shown. The mean fluorescence intensities from fluorescently tagged proteins (r.CD81 and r.CLDN1) and from antibody-stained (anti-CD81 and anti-CLDN1) receptors were obtained by profiling 50 cells. Regions were defined as the nonjunctional PM (black bar), intracellular junctions (white bar), and CJs (gray bar). All cells were imaged under the same conditions, and the data are expressed as arbitrary fluorescence units (F). The data from a single experiment are presented and are representative of two further experiments.

