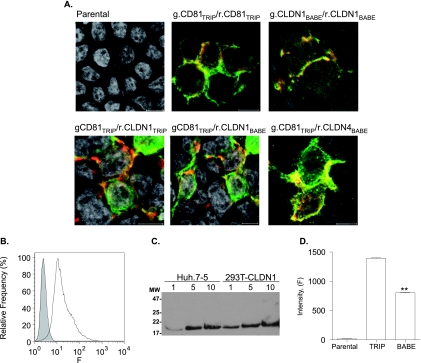
FIG. 3.
Expression and colocalization of fluorescently N terminus-tagged CD81, CLDN1, and CLDN4. (A) Confocal images of parental and 293T cells transduced with retroviral vector pTRIP or pBABE expressing g.CD81/r.CD81, g.CD81/r.CLDN1, or g.CD81/r.CLDN4. (B) Flow cytometric analysis of parental (gray, filled histogram) and TRIP-CLDN1-transduced (white histogram) 293T cells stained with anti-CLDN1 (JAY.8). Irrelevant-isotype-matched IgG control-stained parental and transduced cells with mean fluorescence intensities of 8 and 6, respectively. (C) One, 5, and 10 μg of Huh-7.5 and 293T-CLDN1TRIP total cell lysates were separated on a nonreducing 12% SDS-PAGE gel, the proteins were transferred to a polyvinylidene difluoride membrane and probed with anti-CLDN1 (JAY.8), and bound antibody was visualized with horseradish peroxidase-conjugated anti-rabbit IgG and enhanced chemiluminescence. (D) Fluorescence intensities of parental and TRIP-r.CLDN1- or BABE-r.CLDN1-transduced 293T cells. Fifty cells were imaged under the same conditions, and data were expressed as arbitrary fluorescence units (F). The difference in fluorescence between the transduced cell populations was evaluated using the Mann-Whitney method (**, P < 0.01).

