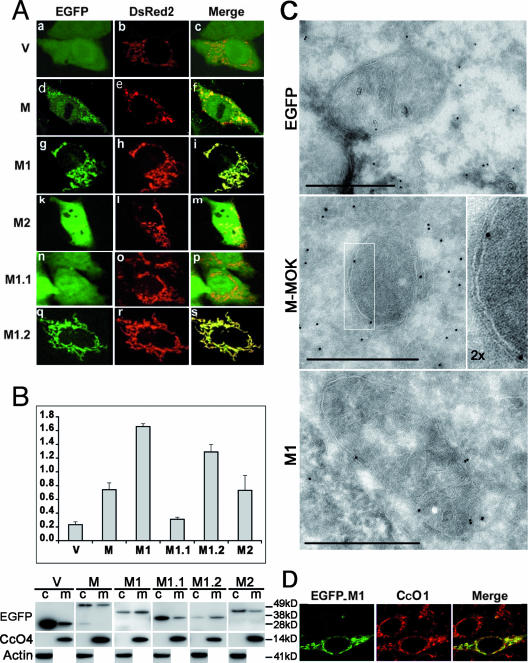
FIG. 4.
M-MOK and fragments M1 and M1.2 are localized in the mitochondria. HeLa cells were transfected with plasmids expressing EGFP-M or its truncated forms M1, M2, M1.1, and M1.2, as well as EGFP alone (V), and were cotransfected with plasmid vectors expressing DsRed2-Mito. (A) The subcellular localization of these various constructions was monitored 24 h posttransfection with a Zeiss Axioplan 2.2 fluorescence microscope. The microscope was equipped with a Zeiss ApoTome system, and representative images revealing mitochondrial localization are shown. Images in the right column (merge) show overlay images between various chimeric constructs of the left column (EGFP) and those of the middle column, which display the mitochondrial pattern of the cell (DsRed2). (B) WB analysis of the cytoplasmic (c) and mitochondrion-enriched (m) fractions of HeLa cells expressing various protein constructs. (Top) Ratio of the mitochondrion-enriched fraction to the cytosolic fraction. Values are obtained by densitometry of WB experiments. Error bars and average values were obtained from two experiments. (Bottom) Representative immunoblot with anti-EGFP, anti-CcO4, and anti-β-actin antibodies. Different times of exposure to the film are used to show EGFP-tagged constructs. However, CcO4 and β-actin bands are obtained from single exposure times. (C) Ultrastructures of mitochondria of HeLa cells transfected with plasmids expressing vector alone (EGFP), the EGFP-tagged full-length molecule (M-MOK), and its M1 fragment after immunogold labeling are shown. Ultrathin cryosections were labeled with polyclonal antibodies against GFP and protein A-colloidal gold. Representative images detailing the localization of M-MOK and M1 in the inner membrane and intermembrane space of the mitochondria are shown. Bars, 0.5 μm for all photos. In the case of M-MOK, the magnification of the framed region of the mitochondria is increased twofold (2×). (D) Representative images acquired by laser scanning confocal microscopy showing the colocalization (merge) of expressed EGFP-M1 and CcO1 (×60 objective, twofold zoom).

